1. Discovery & Requirements Gathering
We kick off with in-depth workshops to understand your business goals, user needs, and technical constraints. This foundational phase ensures complete alignment.
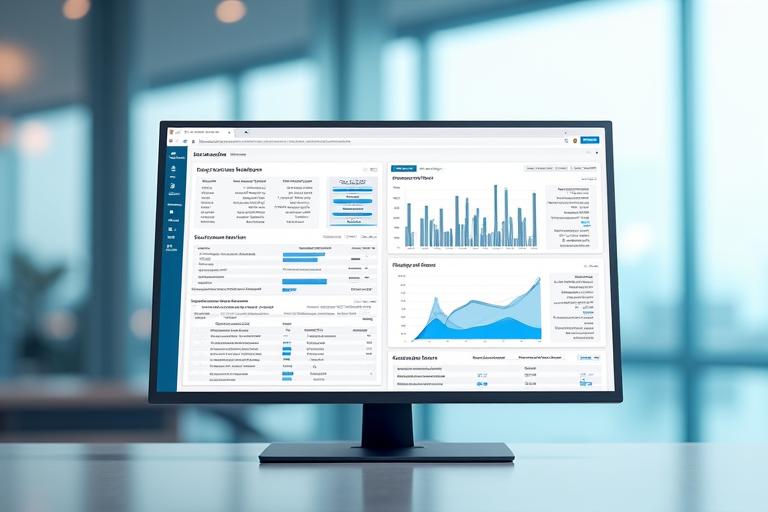
Complex AI analytics shouldn't demand a PhD to understand. ChartWise designs and develops intuitive user interfaces that transform intricate data insights into actionable, user-friendly experiences. We make powerful AI analytics accessible to every user in your organization, driving adoption and accelerating decision-making.
Reduction in user training time with intuitive designs
Increase in tool adoption through improved usability
Average user satisfaction scores consistently
Presenting intricate analytical workflows step-by-step, revealing complexity only as needed, to prevent overwhelming users.
Communicating AI model uncertainty and confidence levels clearly, enabling informed decision-making even with probabilistic data.
Integrating intelligent help and guidance directly into the analytical experience, ensuring users can navigate complex tools effortlessly.
Designing analytical interfaces that adapt seamlessly from desktops to tablets and mobile devices, supporting productivity anywhere.
Adhering to accessibility standards to ensure our analytical tools are usable by all individuals, promoting an inclusive user experience.
Prioritizing speed and efficiency in real-time data visualization and interaction, ensuring analytical tools remain fluid and responsive.

Effective data visualization is the cornerstone of powerful analytical tools. ChartWise specializes in crafting bespoke visualization solutions that reveal the true story behind your AI models and data. We go beyond standard charts:
Our design philosophy is rooted in understanding the people who will use your analytical tools. We employ a rigorous, iterative, and user-centered design process to ensure every interface we create is not only powerful but also a joy to use:
We understand that every industry has unique data, regulatory, and user demands. ChartWise leverages deep industry knowledge to craft analytical interfaces that are not just intuitive but also highly relevant and compliant.
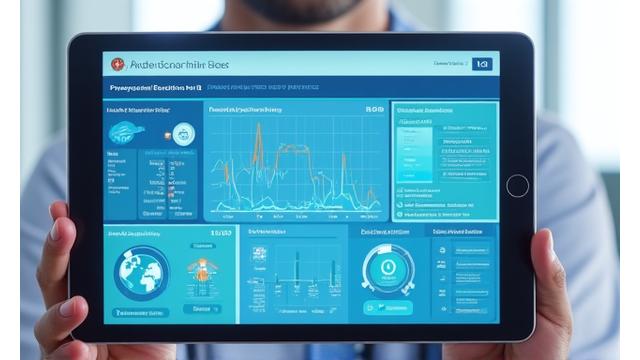
Intuitive interfaces for patient data visualization, diagnostic support, and operational efficiency, adhering to strict compliance.
View Healthcare Case Study
High-precision risk analysis dashboards, real-time trading interfaces, and robust fraud detection tools designed for speed and clarity.
View Finance Case Study
Streamlined interfaces for quality control, predictive maintenance, and process optimization, empowering factory floor to executive teams.
View Manufacturing Case Study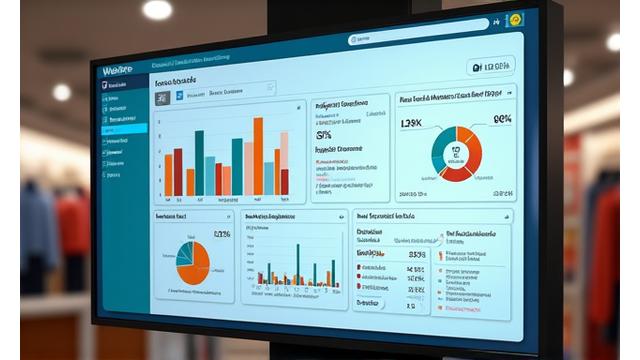
Powerful customer analytics, inventory management, and personalized marketing automation interfaces that drive sales and loyalty.
View Retail Case Study
Robust interfaces for route optimization, real-time fleet tracking, and predictive demand analytics to enhance operational efficiency.
View Logistics Case Study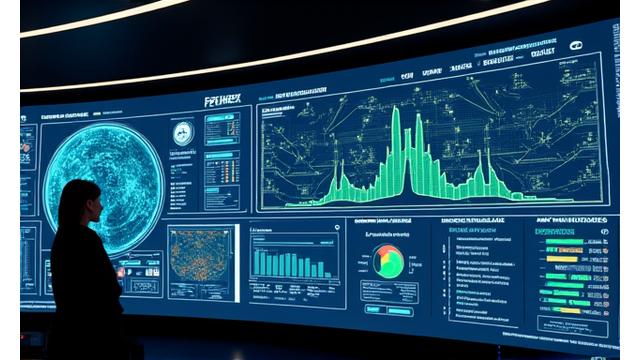
Clear dashboards for grid performance monitoring, predictive maintenance of infrastructure, and consumption trend analysis.
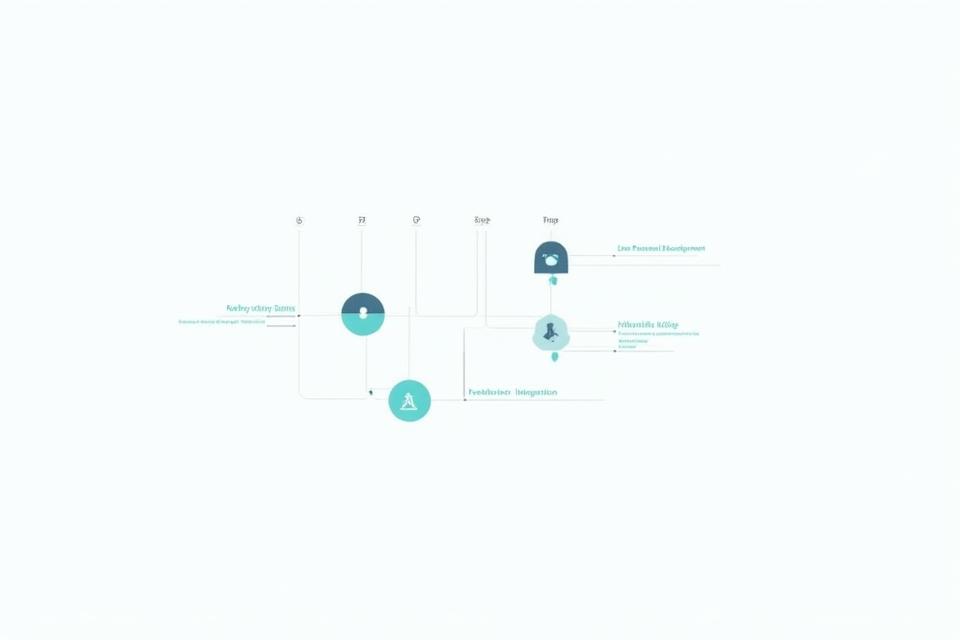
View Energy Case StudyAt ChartWise, we believe the best analytical tools are born from close collaboration. Our transparent and agile process ensures you are integrated every step of the way, transforming your vision into a highly functional reality.
We kick off with in-depth workshops to understand your business goals, user needs, and technical constraints. This foundational phase ensures complete alignment.
Translating ideas into interactive wireframes and functional prototypes, allowing for early feedback and iterative refinements before visual design begins.
Crafting a visually stunning interface, adhering to your brand guidelines, and developing a comprehensive design system for consistency and future scalability.
Bringing the designs to life with robust, responsive, and performance-optimized frontend code, ready for integration with your AI back-end.
Thorough user acceptance testing to ensure the interface meets all functional and usability requirements, followed by iterative refinements.
Providing ongoing support, monitoring performance, and implementing continuous optimizations to ensure your analytical tools evolve with your needs.
Unlock the full potential of your AI insights with a user interface designed for clarity, efficiency, and impact. Let ChartWise help you create an analytical tool that users will love and rely on.
Discover how a tailored interface can revolutionize your operations. Our specialists are ready to discuss your specific challenges and demonstrate our proven approach.